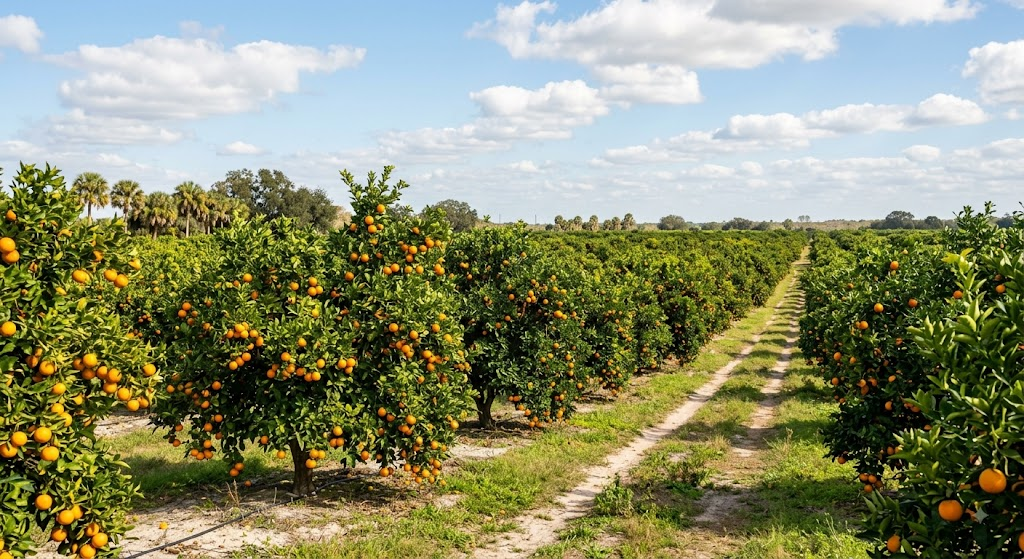
We went looking for solar opportunity in Florida's citrus collapse. We found something more useful: a map of where the land actually went.
Florida has lost most of its citrus. In the six counties at the heart of the industry — DeSoto, Hardee, Hendry, Highlands, Polk, and St. Lucie — commercial citrus acreage has fallen 62% since 2004, from roughly 469,000 acres to 177,000, according to USDA's 2009 historical county table and 2025 Commercial Citrus Inventory. UF/IFAS economist Ariel Singerman's county attrition analysis points to citrus greening, weak grove profitability, real-estate pressure, and solar development as the forces behind the county-level losses.
When we started this study, our question was simple: is all that vanishing grove land an opportunity for solar?
The short answer is "yes, but far less than you'd think." Solar sits on less than 1% of the historical citrus footprint. The more useful finding is what did win the acre — and what that tells a developer about where a landowner conversation is actually worth having.
The study at a glance
| Counties | DeSoto, Hardee, Hendry, Highlands, Polk, St. Lucie |
|---|---|
| Citrus acreage, 2004 | 468,788 |
| Citrus acreage, 2025 | 176,988 |
| Lost | 291,800 acres (−62.2%) |
| Historical citrus land now under solar arrays | 5,315 acres (0.90%) |
We overlaid three layers: historical land-use maps from Florida's water management districts, the Florida Department of Environmental Protection's current statewide land-use data, and the mapped site boundaries of every operating utility-scale solar project in the U.S. Large-Scale Solar Photovoltaic Database (USPVDB). That let us ask not just "how much citrus disappeared?" but "what is on that land today?"
What won the acre
Most of the historical footprint — 58.8% — is still mapped as active citrus or tree crops. Of the land that transitioned, the winner was not solar, housing, or cattle. It was nothing.
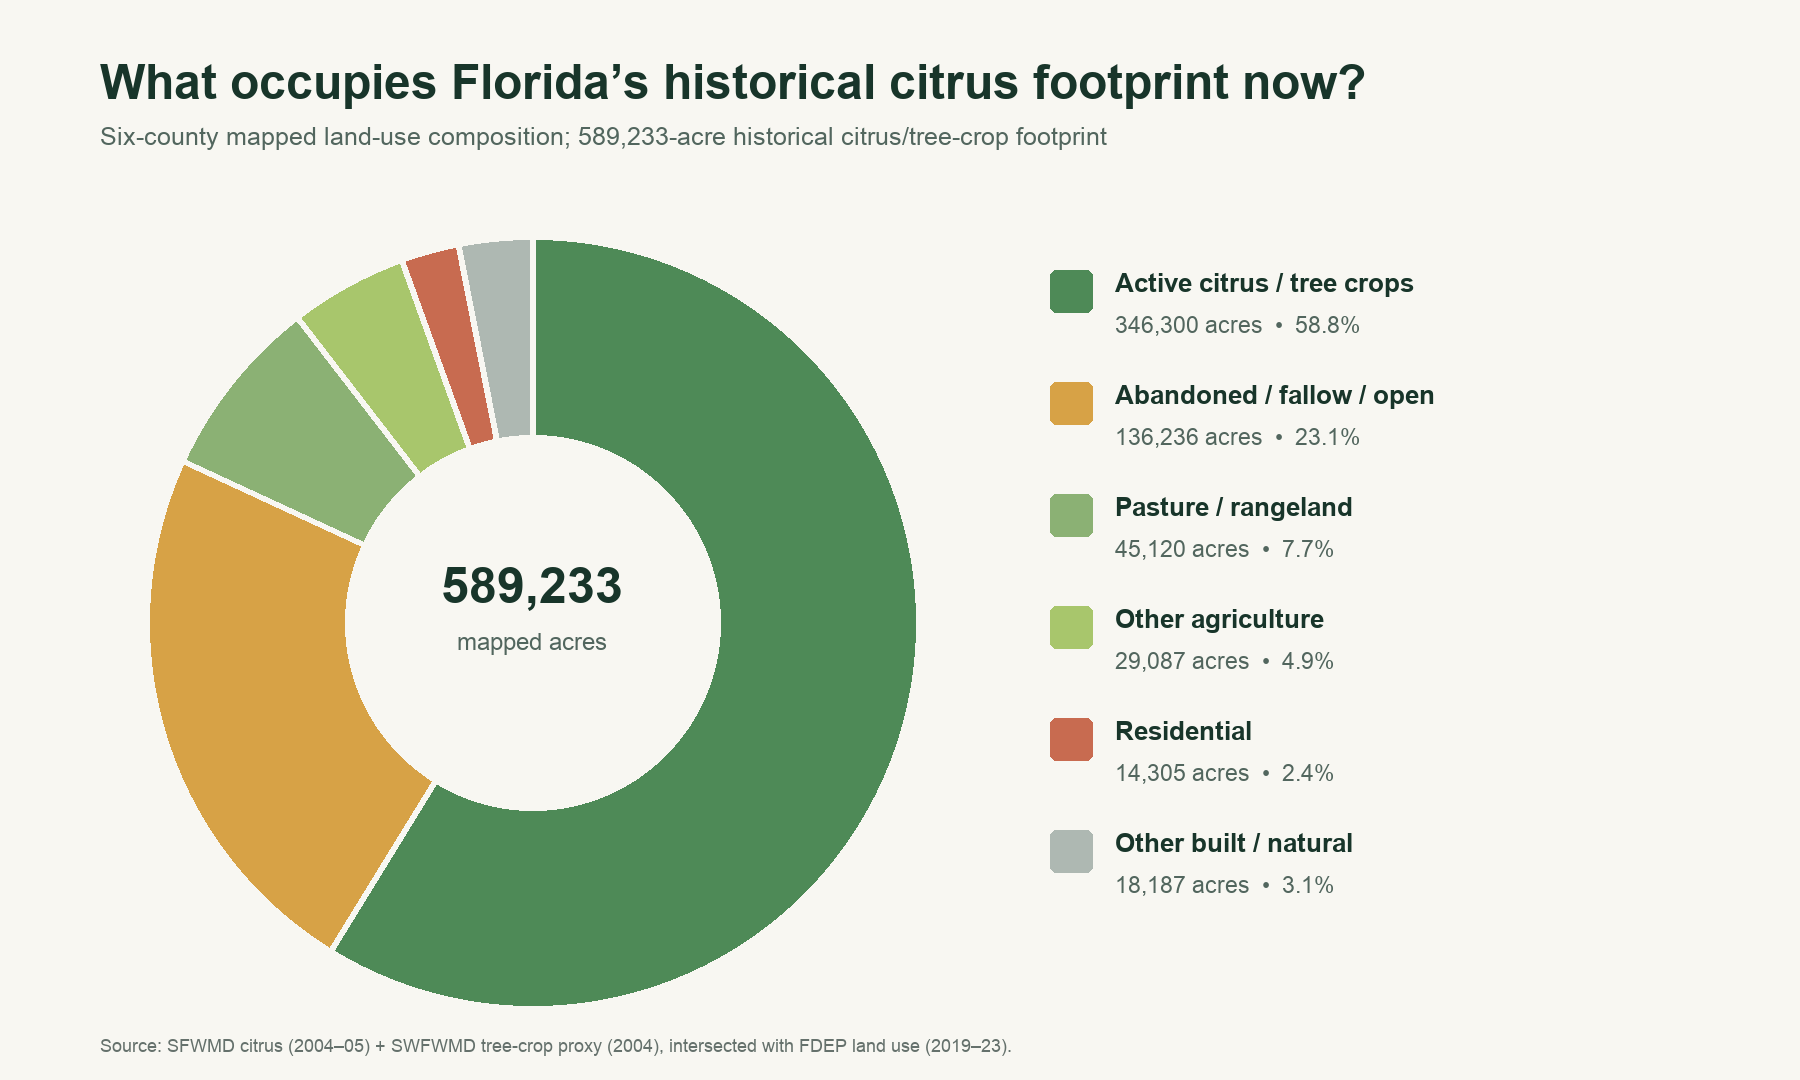
Six-county mapped land-use composition of the historical citrus/tree-crop footprint. Source: SFWMD citrus (2004–05) + SWFWMD tree-crop proxy (2004), intersected with FDEP land use (2019–23).
| Current use of the historical citrus footprint | Acres | Share |
|---|---|---|
| Active citrus / tree crops | — | 58.8% |
| Abandoned groves, fallow cropland, other open land | 136,236 | 23.1% |
| Pasture and rangeland | 45,120 | 7.7% |
| Other agriculture | 29,087 | 4.9% |
| Residential development | 14,305 | 2.4% |
| Solar arrays (directly measured) | 5,315 | 0.9% |
| Utilities, mining, wetlands, conservation, commercial/industrial | — | <1% each |
Nearly a quarter of the former citrus footprint is simply sitting idle. The battle for the acre is not being won by a new productive use. It is suspended.
"Former citrus country" is not one market
The six-county averages hide very different land markets. Each county has its own dominant transition story.
| County | What stands out |
|---|---|
| St. Lucie | The transition in its clearest form. Only 23.9% remains active citrus. Abandoned, fallow, or open land: 46.9%. Pasture 11.2%, other agriculture 9.8%, residential 4.1%, solar 1.44% — the highest solar share in the study. |
| Hendry | The same pattern, less advanced. Active citrus 60.4%, abandoned/fallow/open 27.0%, other agriculture 10.4%, solar 1.12%. |
| Polk | Development pressure. Residential conversion reaches 6.9%, the highest of the six. |
| Hardee | Pasture as the competitor. Pasture share 13.4%. |
| DeSoto | Pasture as the competitor. Pasture share 11.2%. |
| Highlands | Still citrus. 76.1% of the historical footprint remains in active citrus or tree crops. |
Why this matters for a developer: the same "former grove" pitch lands differently in each place. In St. Lucie, inactivity is the norm and a landowner may be ready to talk. In Polk, a solar project competes against a subdivision. In Hardee, it competes against cattle — and taking agricultural land out of production carries a different political meaning when the alternative is a working ranch rather than a dead grove.
Solar is tied to citrus decline — but it's still small
USPVDB v4.0 maps 42 operating project records covering 10,562 acres of solar arrays across the six counties. Because it records actual site boundaries, we could test whether solar was built on former citrus land rather than just in counties that once grew oranges.
- 5,315 array acres sit on land that was historically citrus or tree crops
- Seen from the solar side, that is half of everything built: 50.3% of all solar-array acreage in the six counties is on former citrus land
- Seen from the citrus side, it is almost nothing: those 5,315 acres are just 0.90% of the historical citrus footprint — for every 100 acres that were once grove, less than one now holds solar panels
- 24 of 42 projects overlap the footprint at least partly
- 12 of 42 have more than 99% of their arrays on former citrus land
Both things are true at once: former citrus geography matters a great deal to Florida solar siting, and solar has absorbed only a sliver of the land the citrus transition put in play.
One site, all the layers. Pelican Solar in St. Lucie County shows how this converges on a single parcel. All 313.8 measured array acres fall within the historical citrus footprint. Contemporaneous reporting identifies the property as the former Minute Maid Grove. The county's August 13, 2019 meeting archive and Resolution 19-158 materials document the conditional-use approval for the 74.5-megawatt Pelican Solar Center. Pelican's approval predates the statewide siting law, which does not apply to solar-facility applications submitted before July 1, 2021. Former grove, present solar footprint, project identity, and local approval record — all connected.
Pasture won acres, but cattle didn't win headcount
Pasture is the largest active new use of former citrus land. But it is not a simple story of more grazing for more cows. The Census of Agriculture's 2022 and 2017 county tables show, for 2012–2022:
- Total pasture acreage rose only in Hendry and Polk; it fell in the other four counties.
- Cattle inventories rose in DeSoto, Hardee, and Polk; they fell in the other three.
- Forage, hay, and silage acreage rose in DeSoto, Hardee, Hendry, and Highlands — even where cattle and pasture totals moved the other way.
A "pasture" label can mean several things: feeding an existing herd, replacing pasture lost elsewhere, growing feed for sale, generating lease income, or simply holding a lower-intensity agricultural use while the owner waits. Florida's cattle economy is mostly cow-calf, with many calves shipped out of state for finishing, so more local pasture does not require more local cattle.
Pasture, in other words, is often another form of waiting.
Transition pressure is not project permission
This study shows where a landowner conversation may be more plausible. It does not establish that a parcel can support solar or energy storage.
Florida law removes one common land-use barrier. Under Florida Statutes § 163.3205, solar facilities are a permitted use in agricultural land-use categories and agricultural zoning districts in unincorporated areas. This statewide rule applies across the six counties studied here.
But permitted use does not mean automatic project approval. Counties may regulate buffers and landscaping, although those requirements cannot exceed the standards applied to similar permitted facilities in agricultural districts. Projects must still satisfy applicable environmental, stormwater, access, construction, interconnection, and other development requirements. The law includes batteries and energy storage associated with a solar facility, but it does not create the same statewide siting rule for a standalone battery project.
An abandoned grove can also carry herbicide residues, drainage and irrigation infrastructure, wetlands, title complications, or agricultural tax considerations. UF/IFAS notes that prior grove management can constrain what follows on the land. A physically available parcel may still sit far from usable transmission, face difficult site-specific approvals, or encounter organized opposition. Agricultural zoning can open the door, but it does not determine what can actually be built.
That is where Flypower's work begins. A regional screen like this one surfaces transition signals: agricultural contraction, inactivity, nearby operating projects, and a plausible land-use pattern. Site-specific research turns a signal into a decision by examining the parcel's regulatory pathway, governing bodies, precedent projects, public-record history, social and political risks, stakeholders, and local information environment.
For a developer, the valuable question is not "How many citrus acres disappeared?"
It is:
Which former grove has a willing owner, a usable grid path, a viable entitlement strategy, and a political environment the project can actually navigate?
Florida's citrus decline creates possibilities. The advantage lies in knowing which former grove is a viable project — and which is a permitting battle in disguise.
About the author — Cathy Fleming-Wimer, Ph.D., is a soil scientist by training and a researcher at Flypower. Her work combines agricultural expertise, geospatial analysis, public-record research, and local-market intelligence to examine how land economics, regulation, and community dynamics shape renewable-energy siting and permitting.
Methodology note — We aligned the historical land-use records to Census county boundaries and removed overlaps so each acre was counted once. We grouped current land uses into common categories and assigned small overlapping areas only once. USPVDB measures the area covered by solar arrays, not the full fenced, leased, or project-site area. FDEP's "current" compilation combines source imagery from 2019 through 2023. USDA documents its suppression symbols in the county reports.
Sources
- USDA NASS, Commercial Citrus Inventory — 2009 historical county table and 2025 inventory
- Florida Senate, Florida Statutes § 163.3205, Solar facility approval process and construction requirements (2026)
- Southwest Florida Water Management District, historical Land Use Land Cover
- Florida Department of Environmental Protection, Statewide Land Use (FLUCCS)
- U.S. Geological Survey, U.S. Large-Scale Solar Photovoltaic Database v4.0 · help / methodology
- USDA NASS, Census of Agriculture, Florida county tables — 2022 and 2017
- Florida Department of Agriculture and Consumer Services, Florida's cattle industry (P-00044)
- Singerman, A. (UF/IFAS), Citrus Acreage Attrition by County in Florida, Citrus Industry, Oct. 2023; UF/IFAS, publication HS316
- St. Lucie County Board of County Commissioners, August 13, 2019 meeting archive · Resolution 19-158 materials
- Vero News, August 23, 2019 issue (University of Florida Digital Collections)
- Flypower